
Do people want some good news about Covid-19?
Well you will all have seen this scary graph in some form and be told it is exponential
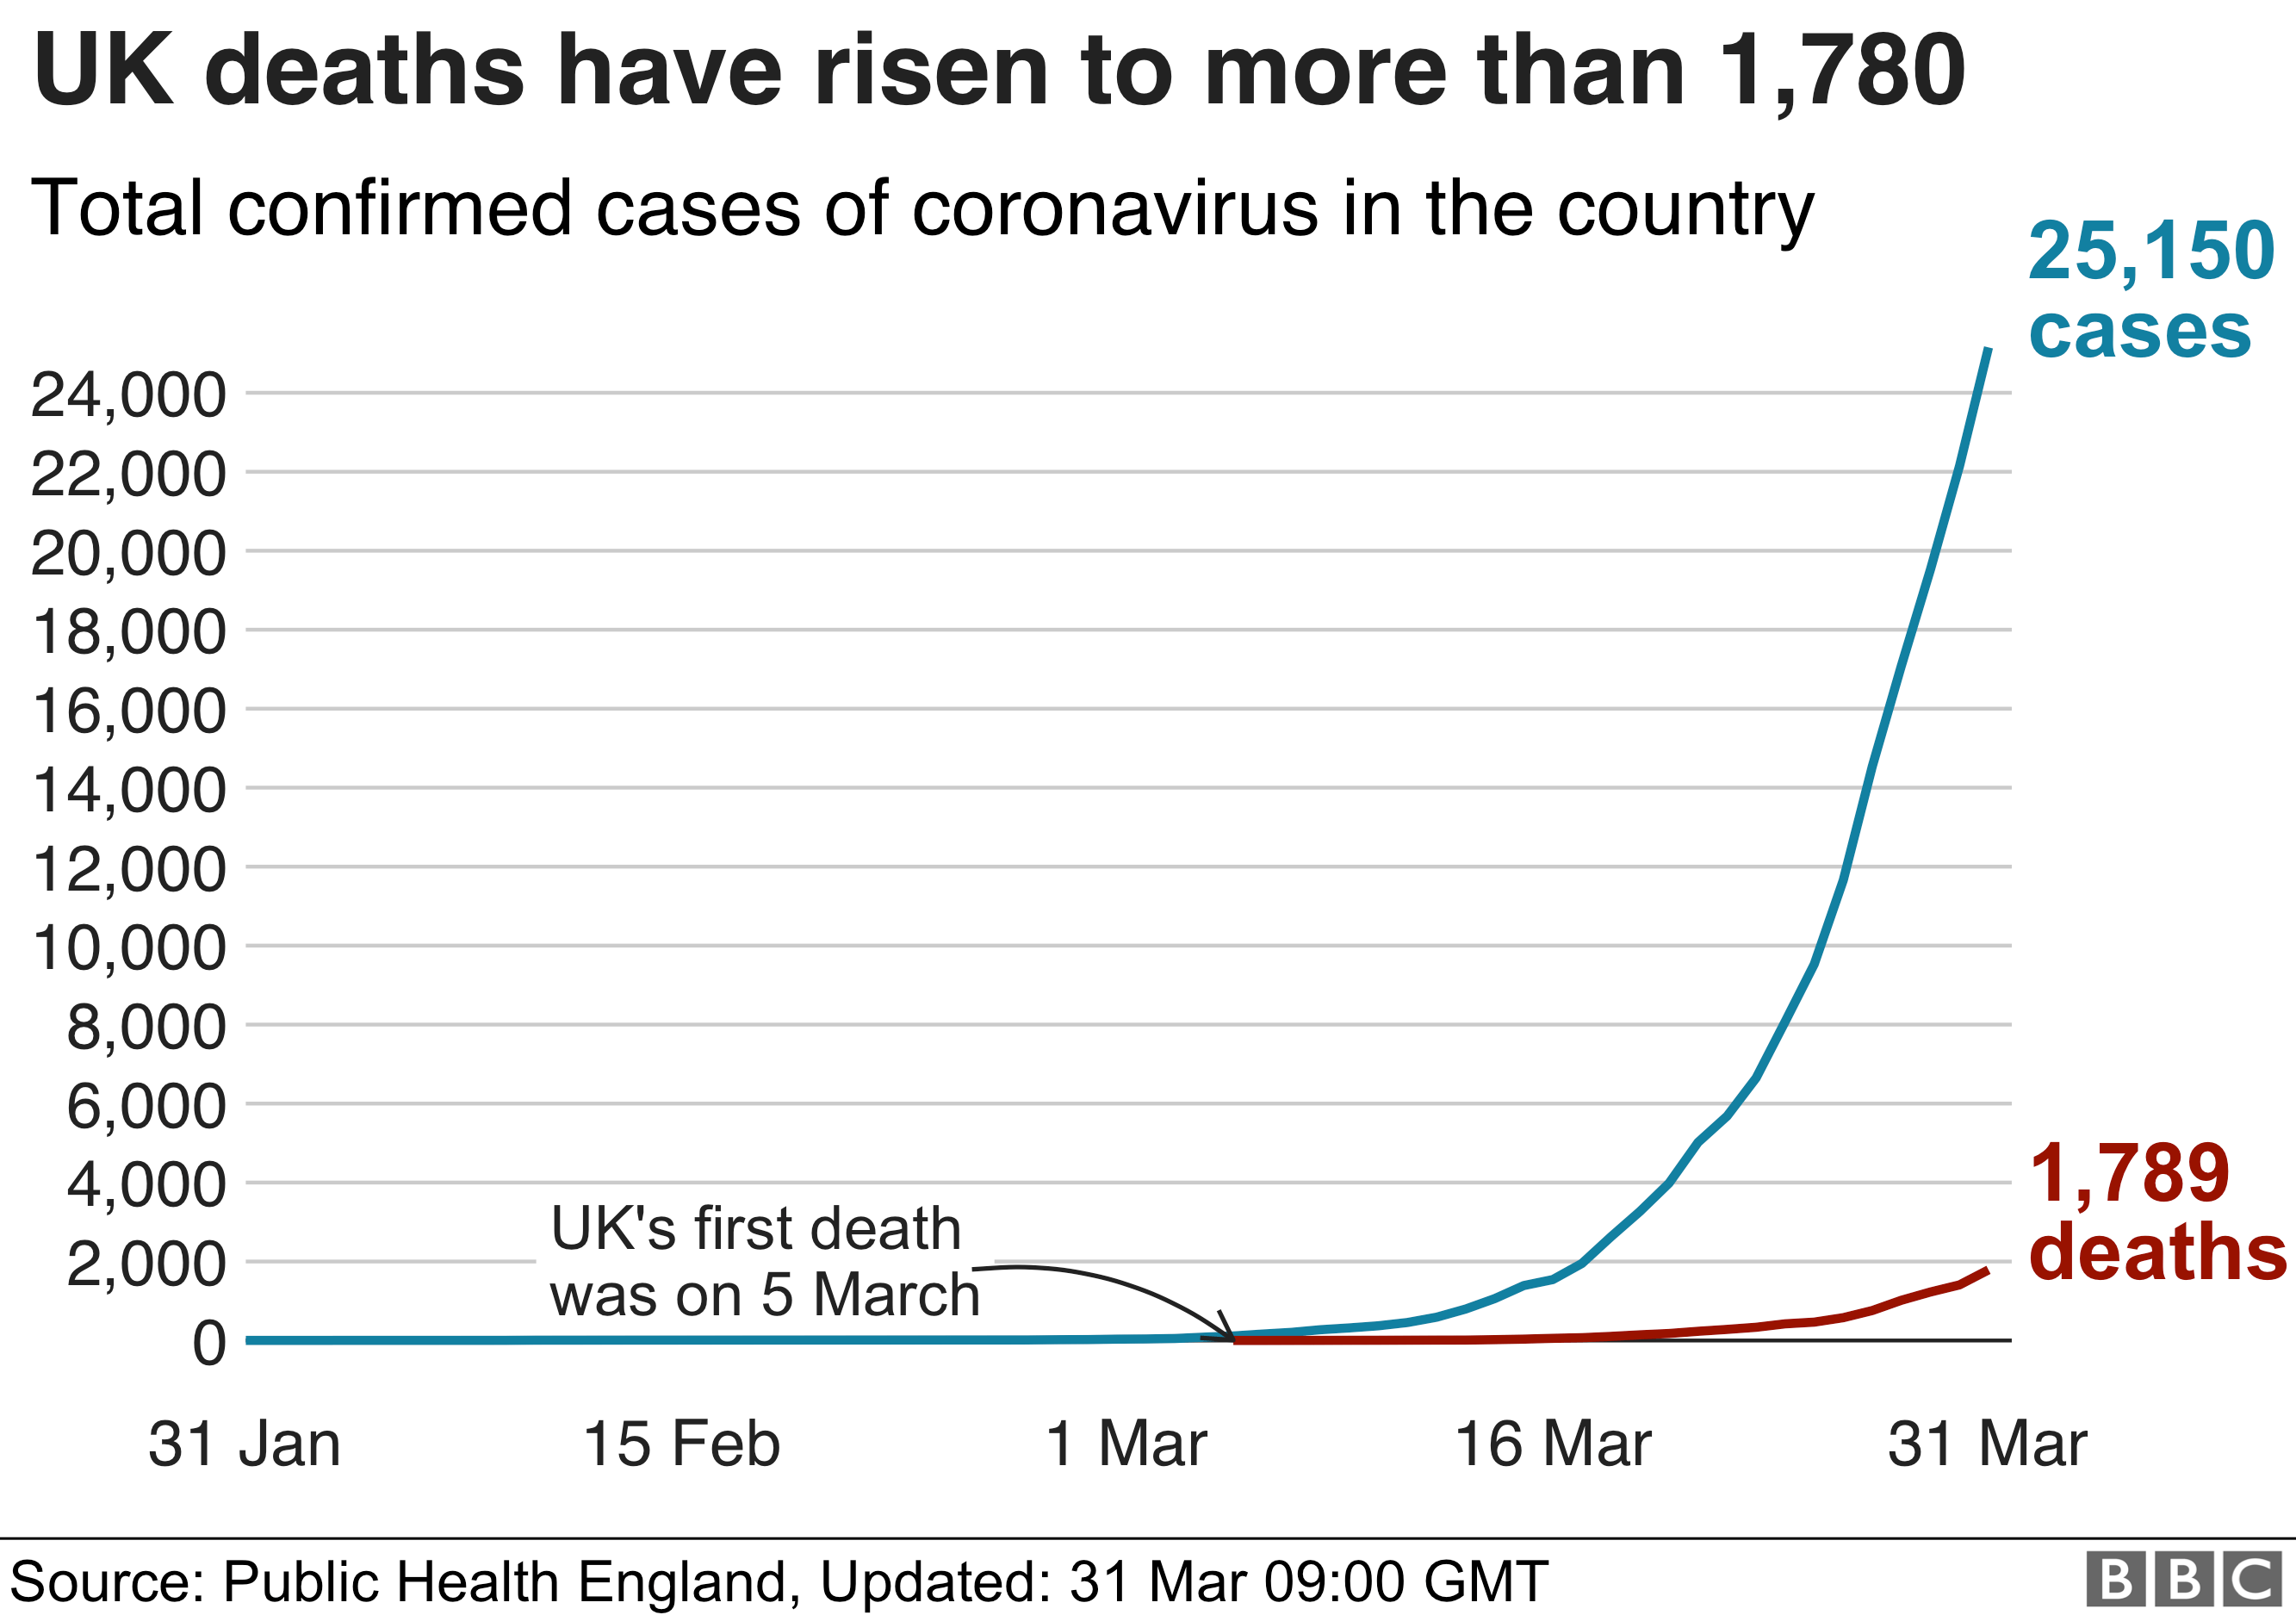
Now the good news is that it is NOT exponential. It is a sigmoid curve,which basically has three stages:
- an exponential start
- a linear middle
- an inverted exponential end (were it flattens to horizontal)
The good news is that I think we have got for the time being into the linear middle bit. This means that we will basically get the same number of new cases and death until something changes.
The graph of daily rates gives the same story:
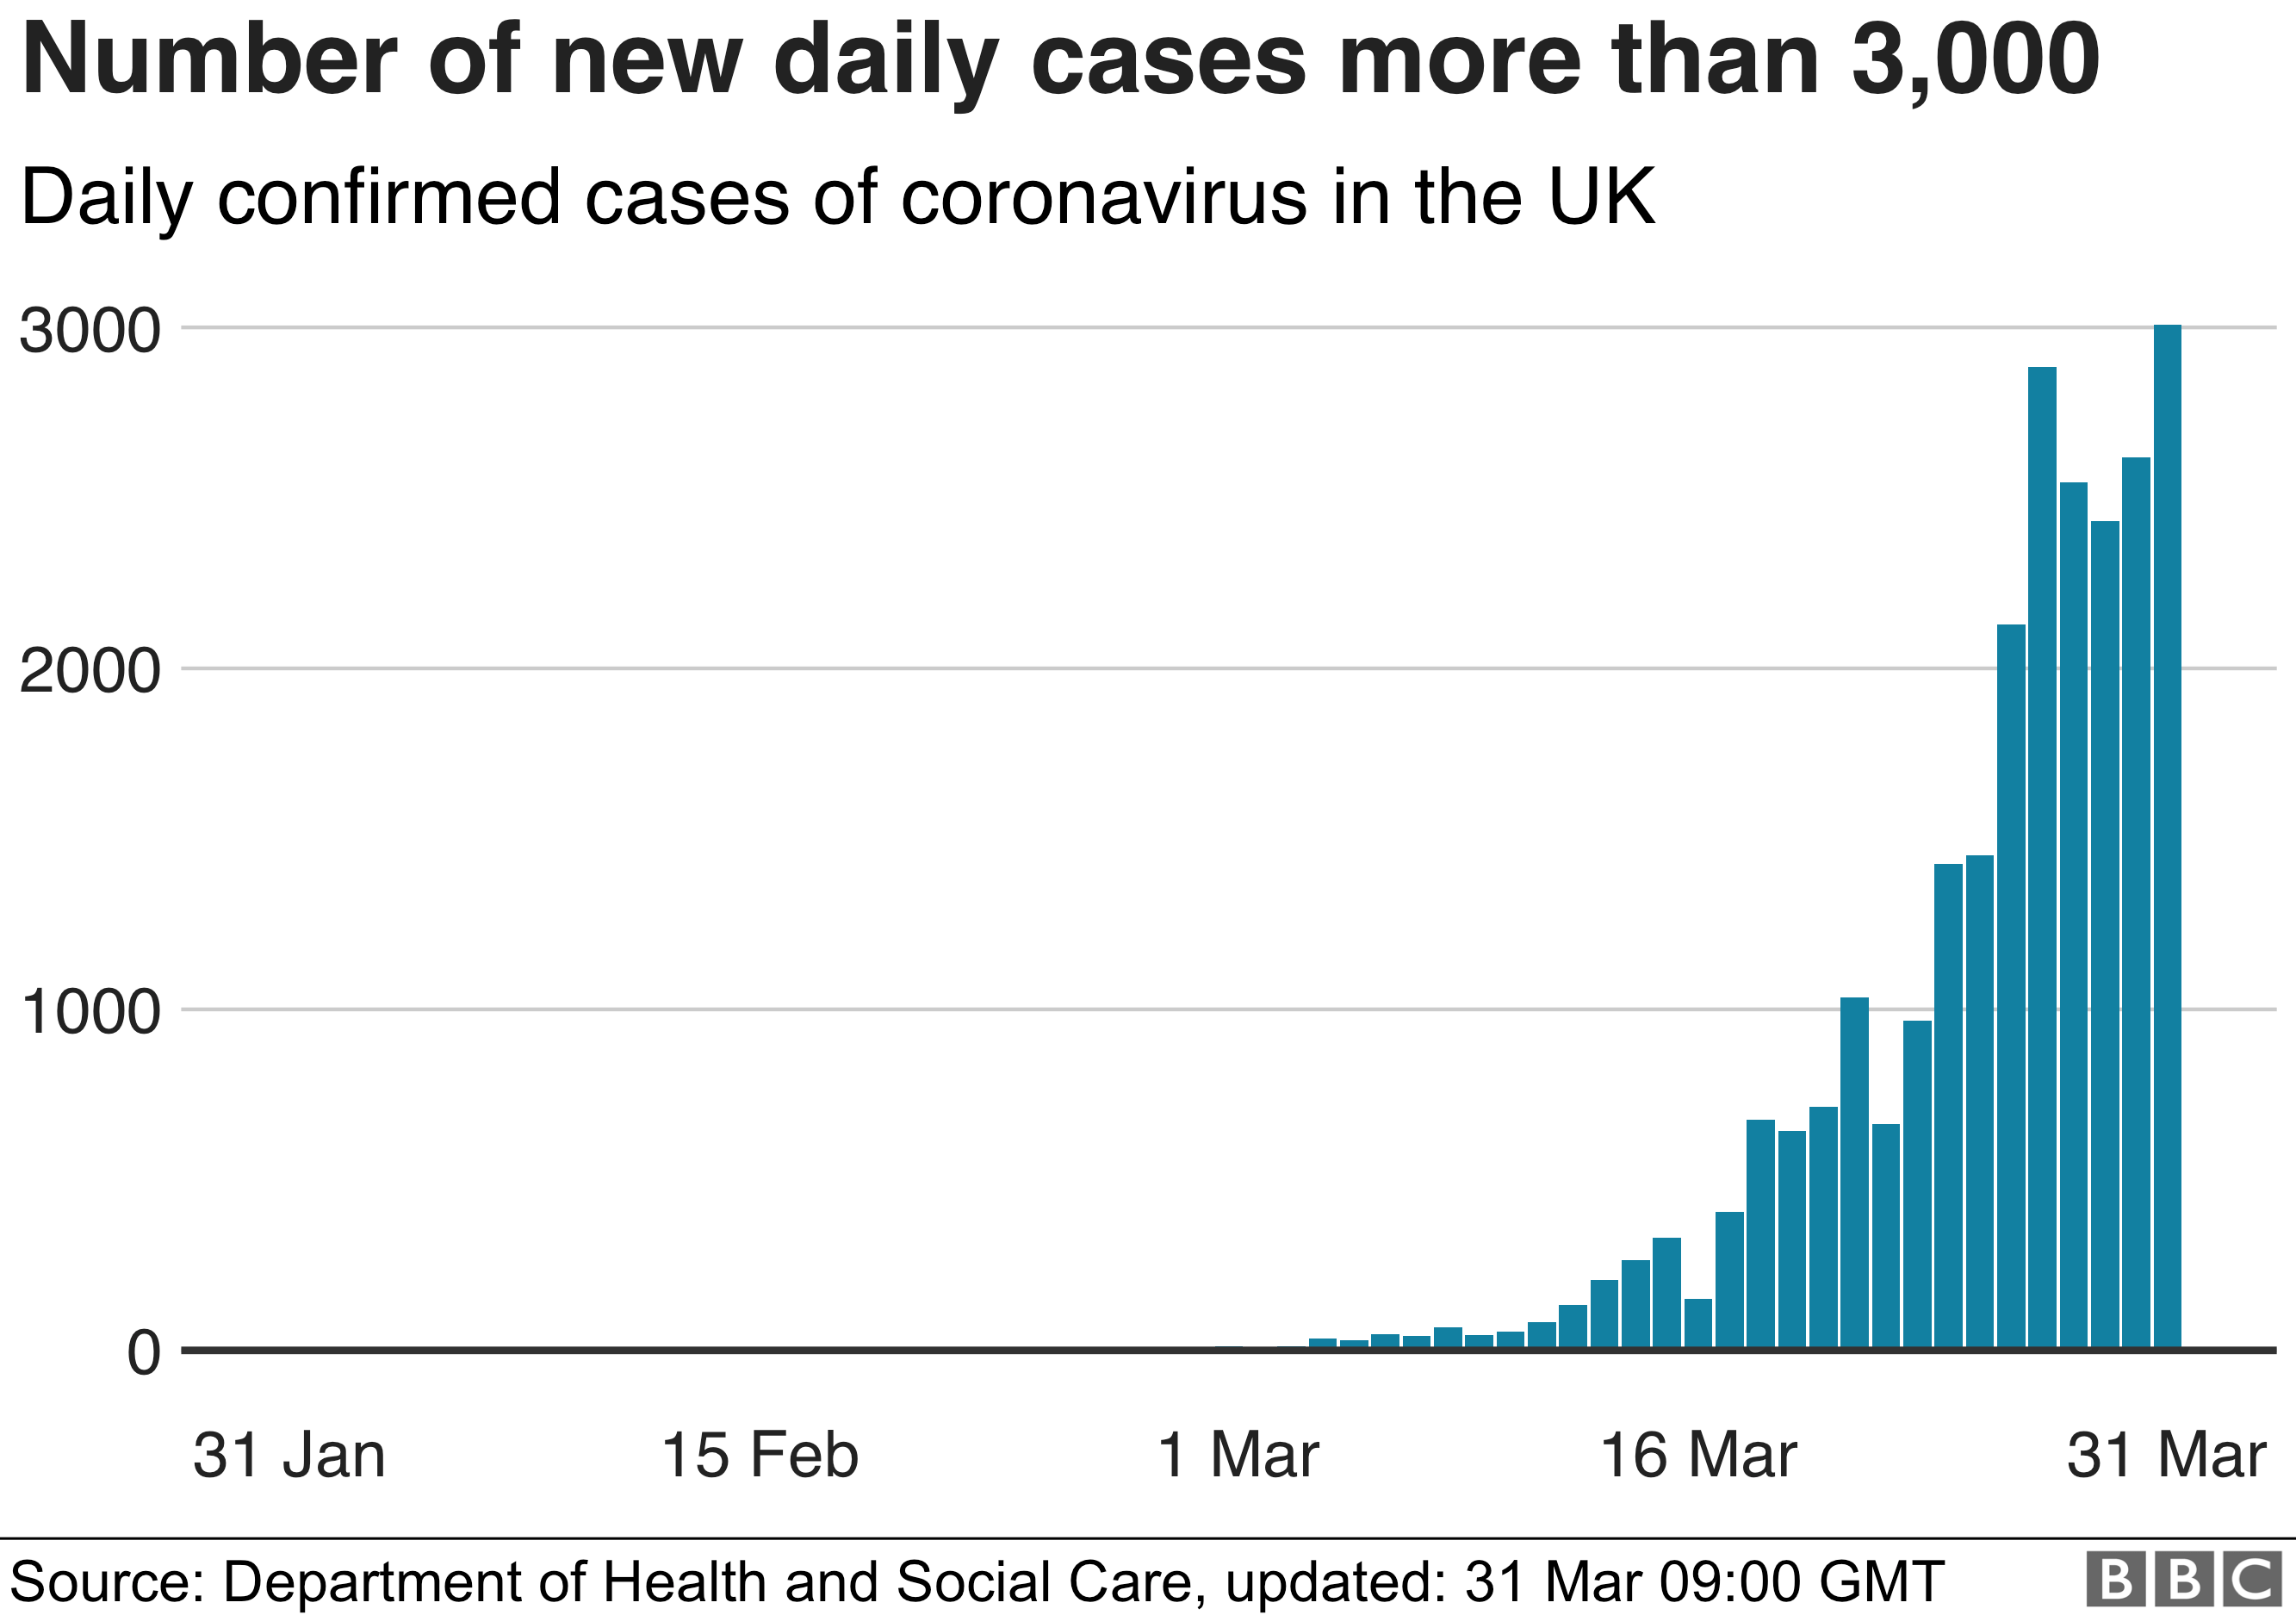
If you notice while we initially have an almost exponential looking increase over the last five days the increase has been small if not negligible. When that starts dropping we are in the final stages of the pandemic.
The continuous exponential curve is a false model. The population of the UK is large but it is definitely finite. With it being finite the exponential curve cannot continue. The exponential part occurs when the illness is new to a population that has no immunity. So each time a person with the disease comes in contact with someone else with the disease they infect that person who then goes on and infects all the people they meet. After a time, however, they start meeting people who have immunity from having had the disease among the people they meet. These people cannot get the disease again as they have the anti-bodies to fight the disease. This makes the curve change from an exponential to an approximately linear curve. When nearly everyone has had the virus and thus has anti-bodies then you start to get the inverted exponential curve of the end-stage.
Unfortunately, I think in current circumstances I do not think we are going to see the change into the inverted exponential end-stage just yet. I suspect one of three things will happen.
- We could see a broadening in the test criteria, this would lead to a jump in the number of positives because we are testing more people than we were before. The curve will become steeper but will remain basically straight
- We reduce social distancing too quickly. Basically, we have cut down the population available to the virus by our social distancing measures. As we reduce the social distancing measures we effectively increase the population to include new people who have not had the disease. If we ease restrictions too quickly it will put us straight back into the initial exponential part of the curve. We really do not want to do that until the daily rate of cases identified starts reducing and then we want to do it slowly and stepwise
- We remain in the straight piece for a very long time. This is if everything is managed well. We slowly lighten restrictions, allowing some people to go out more but at such a rate that the disease does not really get the chance to go off again.
So one battle won, but this campaign is going to contain many battles and everyone we lose will cost lives.
O for those who want to know what sort of curve it is, there is a variety of possibilities. The most usual one for statisticians is the logistic/logit but you can look at the probit, hyperbolic tangent and the arctangent. You can find a longer list on Wikipedia